Population, growth, and relative value in a shifting U.S. market
Contents
- Key takeaways
- Why multifamily remains a core asset class
- The national housing backdrop
- Why North Carolina stands out
- North Carolina vs other major markets
- Market dynamics in North Carolina
- ADL capital investment approach
- Positioning across the risk spectrum
- The opportunity today
- A disciplined approach to multifamily investing
- Next steps
Key takeaways
Strong population growth continues to outpace national trends
North Carolina has grown faster than the national average since 2020, driven by migration and new household formation. More people moving in means more renters entering the market, which directly supports occupancy and long-term housing demand.
Job creation concentrated in high-growth metros
Charlotte and Raleigh-Durham continue to see steady job creation across finance, tech, and life sciences.
When jobs grow in multiple industries, renter demand becomes more stable and less tied to a single economic cycle.
Migration trends support long-term demand
North Carolina remains one of the top destinations for domestic migration. New residents often rent before buying, which creates a steady pipeline of demand across both urban and suburban submarkets.
Relative affordability vs coastal markets
Compared to coastal markets, North Carolina still offers a more manageable cost of living. That matters because rents are more likely to stay within reach of local incomes, supporting occupancy and reducing turnover risk.
Supply constraints support rent stability
New deliveries have created some short-term softness in certain metros. But the longer-term picture still favors workforce housing, where demand is tied to everyday affordability rather than luxury pricing.
At a glance
NC population growth since 2020: 5.8%
U.S. population growth since 2020: 2.6%
NC net domestic migration, 2023–2024: 82,288
New NC jobs announced in 2024: 16,956
NC announced capital investment in 2024: $15.2B
Why multifamily remains and will always remain a core asset class
Multifamily remains one of the clearest ways to invest in a basic need for all human beings: housing. It combines monthly cash flow and operating flexibility in a way that few other asset classes do. That does not make it immune to interest rates or capital market volatility, but it does help explain why apartments remain a cornerstone allocation across market cycles.
The larger point is simple. Demand for rental housing does not disappear when markets get more uncertain. It may shift by price point, submarket, or product tier, but the need itself remains durable. That gives multifamily a strategic role that is less about hype and more about staying connected to a deep, recurring source of demand.
Income stability through rental cash flow
Multifamily income is generated across a broad base of tenants rather than a small number of large occupiers. That diversification matters at scale. The Census Bureau’s rental housing framework covers about 49.7 million U.S. rental units, including 19.5 million in properties with 50 or more units, underscoring the sector’s size and institutional relevance. Lease structures also support recurring income management: the BLS found that 59.6% of leases were 12 months and 31.8% were month-to-month, providing owners with regular opportunities to manage renewals, pricing, and occupancy. Even with some softening, the national rental vacancy rate was 6.9% in Q4 2024 and 7.2% in Q4 2025, which points to adjustment rather than breakdown.
CHART + TABLE CAN GO SIDE-BY-SIDE ON THE BROCHURE
| Indicators of cash-flow stablity | Figure |
|---|---|
| Total U.S. rental units in Census RHFS framework | 49.7 million |
| Units in 50+ unit properties | 19.5 million |
| 12-month leases | 59.6% |
| Month-to-month leases | 31.8% |
| National rental vacancy rate, Q4 2024 | 6.9% |
Lower volatility compared to public markets
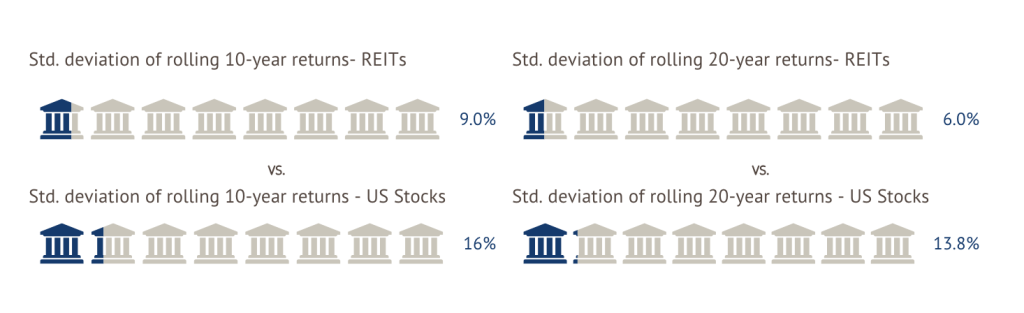
Apartment fundamentals usually adjust through occupancy, concessions, lease rollover, and rent growth rather than the minute-by-minute repricing seen in public equities. Long-term market data helps support that point. Nareit found that the standard deviation of rolling 10-year returns was 9.0% for REITs versus 16.0% for U.S. stocks, and on a 20-year basis, the gap was 6.0% versus 13.8%. That does not mean real estate is immune to repricing, but it does reinforce the idea that property performance often moves through operating fundamentals rather than daily sentiment. For investors, the tradeoff is also different: as of May 30, 2025, All Equity REITs had a 3.99% dividend yield versus 1.24% for the S&P 500.
| Volatility / income comparison | REITs | U.S. stocks |
|---|---|---|
| Std. deviation of rolling 10-year returns | 9.0% | 16.0% |
| Std. deviation of rolling 20-year returns | 6.0% | 13.8% |
| Dividend yield (May 30, 2025) | 3.99% (All Equity REITs) | 1.24% (S&P 500) |
| 10-year compound annual total return | 6.17% | 12.86% |
Inflation alignment through rent growth
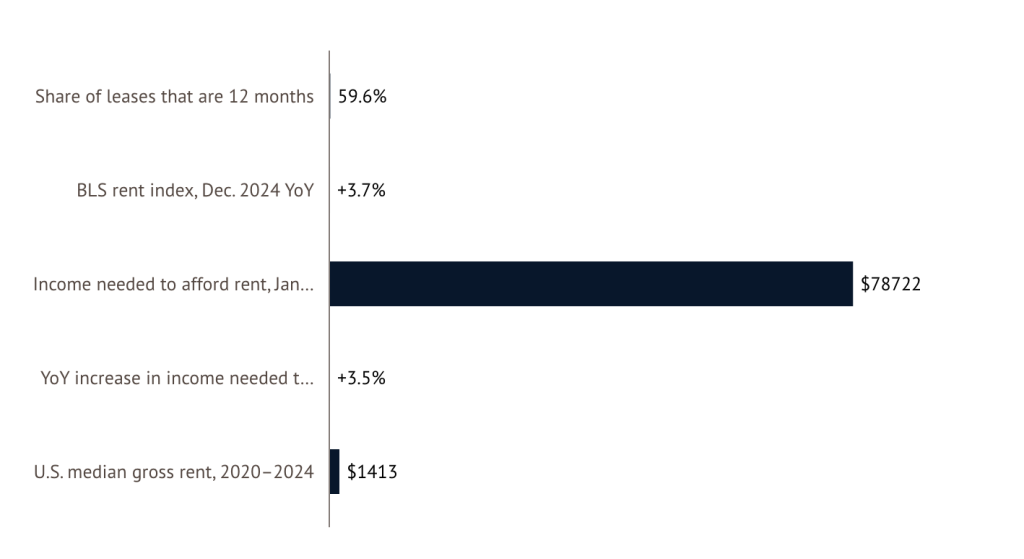
Because apartment leases reset more frequently than many other real estate income streams, multifamily owners have more regular opportunities to reprice income. The BLS found that 59.6% of leases were 12 months, which helps explain why rent trends can move through the system more steadily over time. In the December 2024 CPI release, the rent index was up 3.7% year over year, while Zillow reported in January 2025 that the income needed to afford rent had risen 3.5% from a year earlier to $78,722. That doesn’t mean rent growth is unlimited, but it does show why multifamily is often viewed as one of the more practical real estate sectors for adjusting income in an inflation-sensitive environment.
| Inflation / rent reset indicators | Figure |
|---|---|
| Share of leases that are 12 months | 59.6% |
| BLS rent index, Dec. 2024 YoY | +3.7% |
| Income needed to afford rent, Jan. 2025 | $78,722 |
| YoY increase in income needed to afford rent | +3.5% |
| U.S. median gross rent, 2020–2024 | $1,413 |
Long-term demand driven by housing shortages
Housing undersupply and homeownership affordability pressure continue to support renter demand nationally. That backdrop reinforces the long-term relevance of well-located rental housing even when short-term supply waves create temporary softness.
| National multifamily support indicators | Latest figure | Why it matters |
|---|---|---|
| U.S. housing supply gap, 2024 | ~3.8 million homes | Structural undersupply continues to support renter demand |
| U.S. housing supply gap, 2025 | 4.03 million homes | The shortage widened rather than closed |
| U.S. typical asking rent, Jan. 2025 | $1,968 | Shows rents remain elevated even after the post-2022 cooldown |
| U.S. asking rent growth, Jan. 2025 | +3.5% YoY | Rent growth remained positive despite more supply |
| U.S. apartment rent per unit, Q4 2024 | $1,729 | Useful benchmark for comparing local markets |
| U.S. apartment vacancy, Q4 2024 | 8.0% | National softness stayed manageable even after record deliveries |
[Optional chart placement] We can use one chart here: either U.S. housing supply gap over time or rent growth vs vacancy.
The national housing backdrop
The North Carolina story sits inside a larger national shift. Housing has become less affordable in many U.S. markets, migration has increasingly favored lower-cost and business-friendly regions, and the renter pool has stayed larger for longer as homeownership remains difficult for many households to access. North Carolina is participating in a broader reallocation of people and housing demand across the country.
The U.S. housing supply gap
The national housing shortage remains one of the strongest structural supports for rental housing. Even with more development activity, completions have not fully closed the gap between supply and underlying household demand.
Migration shifting toward Sunbelt markets
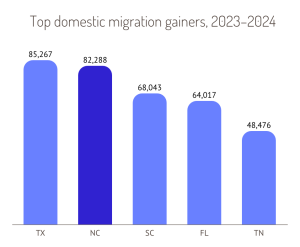
Recent migration patterns continue to favor the South. Among the biggest domestic migration gainers between 2023 and 2024 were Texas, North Carolina, South Carolina, Florida, and Tennessee.
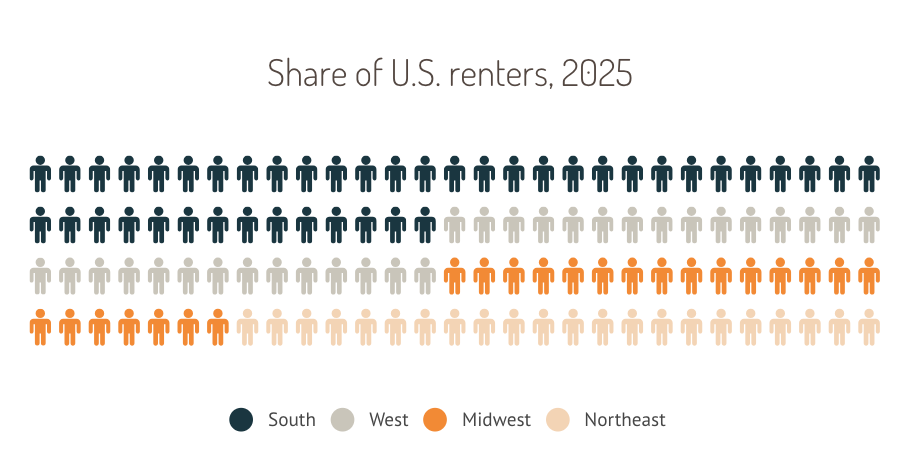
- South — 37%
- West — 25%
- Midwest — 19%
- Northeast — 19%
FOR THIS WE CAN ADD THE % ON A SIDE NOTE, OR EVEN A SMALL TABLE TO SHOW THE DATA
Rent growth trends across regions
Rent growth has moderated from peak levels, but it has not collapsed. Instead, markets have become more differentiated. That is positive for disciplined investors because it puts more emphasis on local fundamentals, affordability, and supply pipelines rather than broad market momentum.
Affordability pressures shaping demand
As the cost of buying a home rises, more households remain renters longer. That does not mean rent can rise indefinitely, but it does mean rental housing remains central to the broader U.S. housing system.
| Macro Backdrop Dataset | Figure |
|---|---|
| U.S. Population Growth, 2023–2024 | ~1.0% |
| Top Domestic Migration Gainers, 2023–2024 | TX 85,267; NC 82,288; SC 68,043; FL 64,017; TN 48,476 |
| Largest Share of Renters by Region, 2025 | South 37%; West 25%; Midwest 19%; Northeast 19% |
| U.S. Rent Affordability, August 2025 | 28.9% of Household Income |
HERE WE CAN GATHER EACH ROW AND MAKE DIFFERENT CHARTS/IMAGES WITH ICONS MIXED WITH TEXT, instead of just having the table or bullets for the data
Why North Carolina is special
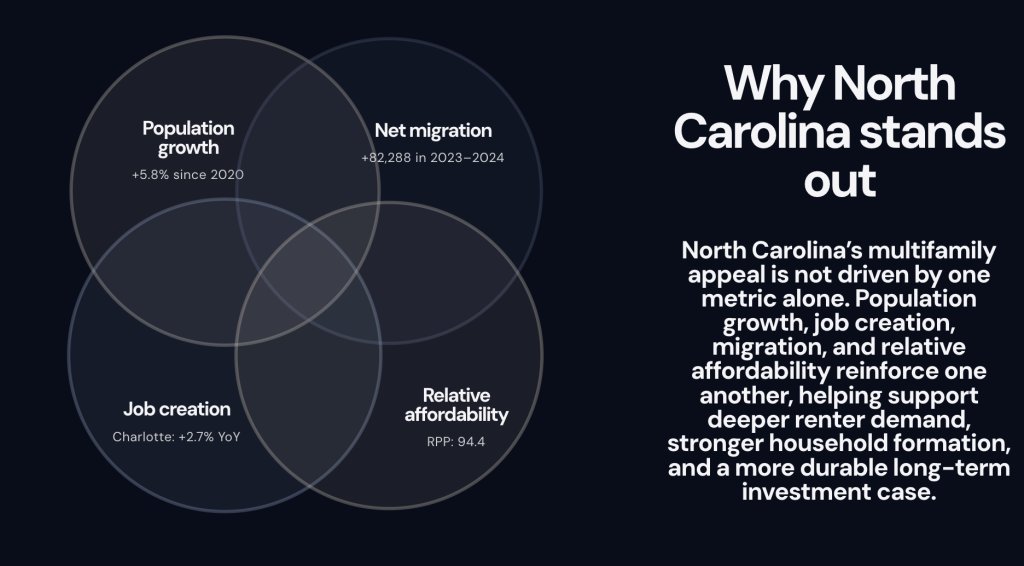
North Carolina stands out because it offers several drivers at once: population growth, migration inflows, business expansion, and a cost profile that remains more manageable than many larger coastal markets. That combination is what gives the state its multifamily relevance. It is not only growing; it’s growing in a way that still leaves room for affordability, labor force depth, and operating flexibility.
The statewide story is also supported by multiple metros rather than one single engine. Charlotte and Raleigh-Durham lead the narrative, but Greensboro, Winston-Salem, High Point, and Wilmington also matter in the broader investment map.
Population growth vs. the U.S. average
North Carolina has outpaced U.S. population growth since 2020, driven by steady in-migration and new household formation.
More households forming means more renters entering the system, which supports occupancy even when supply increases.
Net migration inflows by state
The state ranked near the top nationally for net domestic migration in 2024. That kind of inflow creates a consistent demand base, especially from renters who relocate first and buy later.
Job growth in Charlotte and Raleigh-Durham
Charlotte remains one of the stronger large-metro employment stories in the U.S., while Raleigh-Cary also posted solid year-over-year gains. Together, they give the state a more diversified employment base than many single-metro growth stories. That mix matters. Demand is not tied to a single industry, which helps reduce volatility during economic shifts.
Corporate relocations and economic diversification
North Carolina’s economic diversification continues to deepen through manufacturing, life sciences, technology, finance, and business services. The state announced nearly 17,000 new jobs and more than $15 billion in capital investment in 2024 alone.
Cost of living advantage vs major metros
North Carolina’s statewide regional price parity remains below the national average. That does not mean every NC submarket is cheap, but it does support the broader case for relative affordability.
| North Carolina Growth Dataset | North Carolina |
|---|---|
| Population Growth Since 2020 (to July 2024) | 5.8% |
| Population Growth Since 2020 (to July 2025) | 7.2% |
| Net Domestic Migration, 2023–2024 | 82,288 |
| Charlotte Large-Metro Employment Growth, Dec. 2024 YoY | +2.7% |
| Raleigh-Cary Employment Growth, 2023–2024 | +1.7% |
| New NC Jobs Announced in 2024 | 16,956 |
| Announced NC Capital Investment in 2024 | $15.2B |
| NC Regional Price Parity, 2024 | 94.4 |
Best chart : NC population growth vs U.S. average, maybe the rest of the data can go into bullets or a stylised table
North Carolina vs other major markets
Markets do not need to be the largest or the “hottest” in the country to be attractive. In fact, for many investors the better question is whether a market offers a more balanced combination of pricing, rent, affordability, and operating resilience than more crowded alternatives. Here, North Carolina becomes compelling.
North Carolina can look like the rational middle ground: Growth-supported and less dependent on stretched assumptions than some higher-priced or more supply-sensitive peers. All while being relatively affordable.
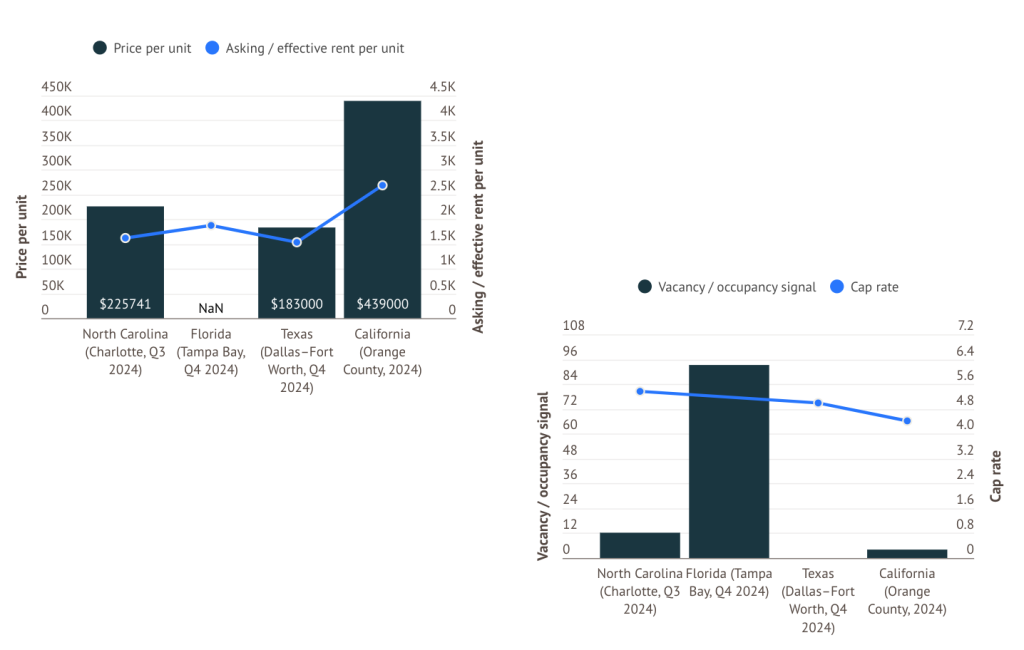
Price per unit comparison (NC vs FL vs TX vs CA)
Public multifamily sale pricing is more consistent at the metro level than at the whole-state level, so the table below uses representative metros as practical proxies: Charlotte for NC, Tampa Bay for FL, Dallas–Fort Worth for TX, and Orange County for CA.
| State proxy market | Price per unit | Asking / effective rent per unit | Vacancy / occupancy signal | Cap rate |
|---|---|---|---|---|
| North Carolina (Charlotte, Q3 2024) | $225,741 | $1,619 | 12.11% vacancy | 5.38% |
| Florida (Tampa Bay, Q4 2024) | ——— | $1,878 | 93.1% stabilized occupancy | ——- |
| Texas (Dallas–Fort Worth, Q4 2024) | $183,000 | $1,531 | Heavy supply wave / softer rent trend | Market cap rates generally above 5% |
| California (Orange County, 2024) | $439,000 | $2,695 | 4.1% vacancy | 4.4% |
Rent levels and growth rates
North Carolina rents sit below many high-cost coastal markets while still benefiting from migration and job creation. That can be a better setup than markets where rent levels have already moved too far ahead of local affordability.
Income growth and tenant affordability
The affordability story is not just about nominal rent. It is about whether rents sit in a range that remains supportable relative to wages and cost of living. North Carolina’s statewide cost structure still compares favorably to markets like California and Florida.
| State / proxy market | Regional price parity (state, 2024) | Representative apartment rent | Positioning takeaway |
|---|---|---|---|
| North Carolina / Charlotte | 94.4 | $1,619 | Good balance of cost and growth |
| Florida / Tampa Bay | 101.3 | $1,878 | Still attractive, but less of a value story than NC |
| Texas / Dallas–Fort Worth | 97.1 | $1,531 | Lower cost, but larger supply pressure |
| California / Orange County | 110.7 | $2,695 | High-barrier market, but much more expensive |
Risk-adjusted positioning across markets
North Carolina’s strength is not that it wins every metric. It is that it scores well across several of them at the same time: pricing, migration, employment growth, and relative affordability.
| Market | Relative affordability | Growth profile | Supply pressure | Overall positioning |
|---|---|---|---|---|
| North Carolina | Stronger than FL and CA | Strong | Moderate by submarket | Balanced growth and relative value |
| Florida | Moderate | Strong | Moderate to high in some metros | Attractive but more crowded |
| Texas | Good | Strong | High in major metros | Scale market with more supply volatility |
| California | Weaker | Selective | Generally lower new supply in many infill markets | High barrier, high cost |
Char here? : price per unit comparison using the four proxy metros. We can build one/two stats per page with charts and infographics
Market dynamics in North Carolina
North Carolina’s investment case still has to work at the operating level. That means understanding supply, absorption, rent movement, occupancy, and where workforce-oriented demand remains strongest. Broad demographics matter, but property performance still comes down to market mechanics.
That is why the state remains most compelling in markets and submarkets where rental demand is tied to everyday employment, commuter convenience, school access, and neighborhood stability rather than purely luxury demand.
Supply vs demand imbalance
Some North Carolina metros have absorbed large supply waves in recent quarters. That has created softer rent growth in the near term, but it has not erased the broader long-term demand story.
New development vs absorption trends
Absorption has been meaningful in both Charlotte and Raleigh. Even as vacancies remain elevated relative to earlier-cycle lows, leasing activity has been solid enough to support the longer-term case for selective acquisitions.
Occupancy and rent stability
Current market conditions favor disciplined underwriting over aggressive rent-growth assumptions. That aligns well with a workforce-housing strategy focused on basis and operational execution rather than speculative pricing.
Workforce housing demand drivers
Workforce housing tends to benefit from a broader renter base, especially in suburban areas where school quality, commute patterns, and neighborhood stability matter more than top-of-market amenity packages.
| North Carolina metro snapshot | Charlotte | Raleigh |
|---|---|---|
| Period | Q3 2024 | Q4 2024 |
| Asking rent per unit | $1,619 | $1,525 |
| Vacancy | 12.11% | 12.05% |
| 12-month absorption | 10,897 units | 7,945 units absorbed in Q4 |
| Sale price per unit | $225,741 | $227,609 |
| Cap rate | 5.38% | 5.25% |
| Market read | Large, liquid, still absorbing major supply | Strong demand, pricing adjusting, still active |
Workforce housing demand drivers
Commute access, neighborhood stability, school quality, monthly affordability, and larger renter-by-necessity cohorts all support this segment in many North Carolina suburbs.
ADL Capital investment approach
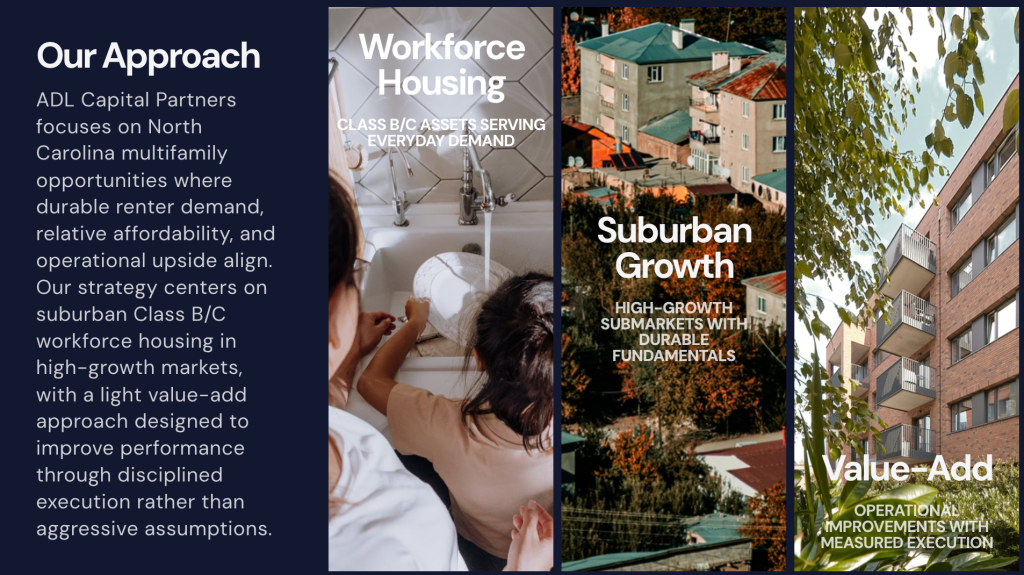
ADL Capital follows a focused, disciplined strategy within North Carolina multifamily. The firm targets opportunities where the purchase basis, resident profile, and operational upside align, without relying on aggressive rent-growth assumptions. The emphasis is on selective acquisitions, measured capital improvements, and execution-driven value creation. Performance is built through operational discipline rather than market timing or speculative projections.
This approach is most evident in workforce-oriented Class B/C suburban multifamily, where durable renter demand, achievable rent levels, and practical value-add opportunities support a more stable operating profile.
Focus on workforce housing (Class B/C assets)
ADL focuses primarily on suburban Class B/C workforce housing, especially garden-style multifamily where resident demand is tied to broad employment rather than luxury demand.
Suburban, high-growth submarkets
The target map includes Charlotte, Raleigh-Durham, Greensboro, Winston-Salem, High Point, and Wilmington, with an emphasis on long-term demographic and supply-demand support.
Light value-add execution strategy
The strategy is light-to-moderate value-add: renovate classic units, mark rents toward market where justified, improve operations, and increase ancillary income without turning the deal into a deep repositioning project.
Target tenant profile and income bands
ADL’s buy box targets households with income levels that support healthier rent-to-income ratios, including AMI above $80,000 and rent-to-income generally below 25% to 30%.
Operational improvements and rent optimization
Value creation is expected to come from collections, occupancy, leasing, payroll efficiency, curb appeal, and ancillary revenue lines such as RUBS, valet trash, bulk internet, parking, and pet fees.
| Investment focus | ADL approach |
|---|---|
| Asset type | Garden-style multifamily; primarily suburban Class B/C workforce housing |
| Target markets | Charlotte, Raleigh-Durham, Greensboro, Winston-Salem, High Point, Wilmington |
| Vintage | 1970s–2010s construction; ideally 1980s–2000s |
| Unit count | 80–200 units, preference for 100+ |
| Capex budget | $5,000–$15,000 per unit |
| Strategy | Light-to-moderate value-add |
| Execution period | 12–24 months stabilization / execution |
| Hold period | 5–7 years |
| Resident profile | AMI above $80,000; rent-to-income below 25–30% |
| Rent margin of safety | Pro forma rents roughly $200–$300 below top-of-market Class A product |
| Debt profile | Agency debt; fixed rate; max 65% LTV; full-term IO preferred; 5–7 year term |
What ADL avoids
Development, hotel conversions, student housing, senior housing, LIHTC assets, full-gut renovations, major structural or environmental problems, high-crime areas, weak school zones, and deals that only work under aggressive rent-growth assumptions.
Positioning across the risk spectrum
Multifamily strategies generally fall somewhere across a familiar risk-return spectrum: core, core-plus, value-add, and opportunistic. The point of this framework is not to overcomplicate the discussion. It is to help investors understand how much operational work, capex, and execution risk a strategy is taking on.
ADL sits in a disciplined value-add position. That means there is real operational upside, but the strategy is not dependent on speculative development or heroic assumptions.
Core
Stabilized assets, lower risk, lower return, income-heavy profile.
Core-plus
Mostly stable assets with moderate leasing or operational upside.
Value-add
Renovation and operational upside with downside protection still visible in the basis and asset profile.
Opportunistic
Highest complexity, often tied to development, deep distress, or major repositioning.
Where ADL focuses and why
ADL’s strategy fits value-add because it targets clear, underwritable opportunities to improve NOI through selective renovations and operational discipline while avoiding the riskiest deal categories.
Balancing cash flow and appreciation
The goal is to combine current cash-flow durability with future value creation rather than maximizing one at the expense of the other.
The opportunity today
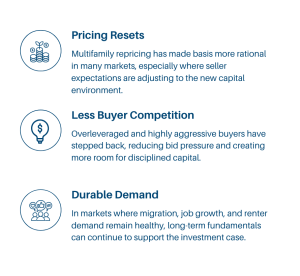
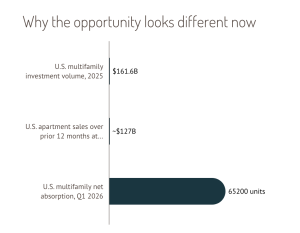
The current market is more selective than it was during the easy-capital years. That has raised the bar for underwriting, but it has also improved the opportunity set for disciplined buyers. When debt gets more expensive and seller expectations lag the new environment, pricing can reset faster than the long-term demand story changes.
That creates room for groups that are patient, basis-conscious, and willing to buy with more realistic assumptions.
| Why the timing looks different now | Implication |
|---|---|
| Higher debt costs | Forces more realistic leverage and pricing assumptions |
| Cap rate expansion | Can improve basis for patient buyers |
| Lower transaction velocity | Reduces momentum-driven competition |
| Supply digestion in key Sunbelt markets | Rewards operators who underwrite conservatively |
| Long-term housing demand still positive | Supports medium-term conviction despite near-term noise |
A disciplined approach to multifamily investing
The strongest investment strategies usually look the least dramatic on paper. They rely on basis, resident affordability, realistic capex, and the willingness to walk away from deals that need too much to go right. In multifamily, discipline matters most when the market becomes less forgiving.
That is what separates a durable strategy from a market-dependent one. The goal is not to underwrite perfection. It is to create a business plan that can perform under a range of realistic conditions.
Selectivity over scale
Scale can support efficiency, but it does not, on its own, produce returns. In the current environment, disciplined investors prioritize selectivity over transaction volume.n Each acquisition must stand on its own merits, with a clear path to performance that does not depend on aggressive rent growth or favorable exit conditions. This often means pursuing fewer opportunities, underwriting more conservatively, and maintaining a consistent investment standard across market cycles.
Mananging the downside is paramount
Risk is best understood as the probability of permanent capital loss rather than short-term volatility and that perspective informs how each investment is structured. Key considerations include acquiring at a defensible basis, maintaining moderate leverage, and aligning rents with what residents can sustainably afford. ADL’s preference for fixed-rate agency debt, conservative loan-to-value ratios, and business plans that remain viable under flat near-term rent scenarios reflects this approach.
The result is a margin of safety that helps protect both income and asset value when market conditions become more uncertain
Long-term hold strategy
Operational improvements, tenant retention, and NOI growth often need time to compound. A longer hold period gives those levers more room to work.
Closing thoughts
Disciplined multifamily investing is rarely about chasing the loudest market. It is about finding durable demand and executing a business plan that still makes sense when market conditions become less generous.
Next steps
North Carolina multifamily remains attractive because it sits at the intersection of growth and relative value. The opportunity is not simply that the state is growing. It is that it is growing in ways that still support resident affordability, labor depth, and a more measured investment basis than many competing markets.
Learn more about current opportunities
Review ADL’s market focus, acquisition criteria, and current opportunities in more detail.
Connect with the ADL capital team
To continue the conversation, connect directly with ADL Capital Partners to discuss strategy, market focus, and current pipeline.
ADL Capital Partners
[Website]
[Email]
[Phone]
Leave a Reply